

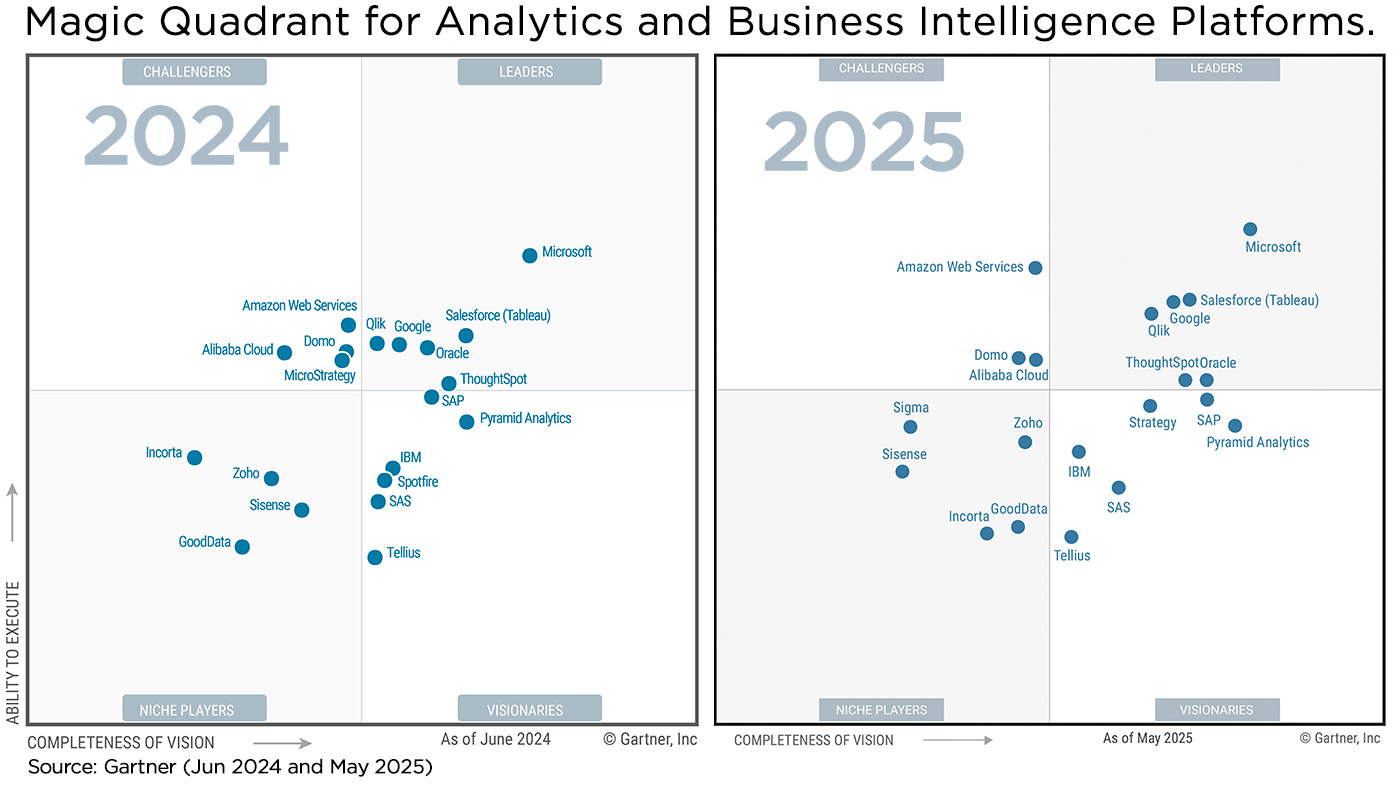
Qlik is named a Leader in the 2025 Gartner Magic Quadrant for Analytics and Business Intelligence Platforms
The 2025 Gartner Magic Quadrant for Analytics and Business Intelligence Platforms – the most referenced document in our industry – is official. Qlik stays in the Leaders Quadrant for the 15th year, moving further up and to the right. The Gartner Report gives you an impartial, wide angle view of the BI landscape.
Unfamiliar with the Gartner Magic Quadrant? This is how it works.
Don’t just look at the picture –
read the report!
In today’s AI-driven world, the difference between reacting and leading depends on how quickly you can turn data into decisions. That’s why it’s essential to select the right solution for your BI and analytics needs.
For the 15th straight year, Gartner has recognised Qlik as a Leader in the Magic Quadrant for Analytics and Business Intelligence Platforms.
Download the Gartner MQ report to get an overview of the analytics market and learn:
- Insights from Gartner into the analytics and BI platforms market
- What makes Qlik a Leader among the top 20 analytics and BI platforms providers
- How to use Gartner criteria to evaluate the best solution provider for your needs
Chris Powell, General Manager, Qlik Analytics, reflects on how Qlik celebrates 15 years as a Leader in this blog post.
The message is clear: we’re executing on the right vision, and the market is taking notice. It’s also driven by a commitment to innovation, trust, and above all, our customers.
Any questions? Contact us!
Bas Haarhuis
Advisor Data & Strategy
bas.haarhuis@climber.nl
+31 6 39 46 39 65
Jordy Wegman
BI Manager
jordy.wegman@climber.nl
+31 6 11 62 68 58
Nieuws
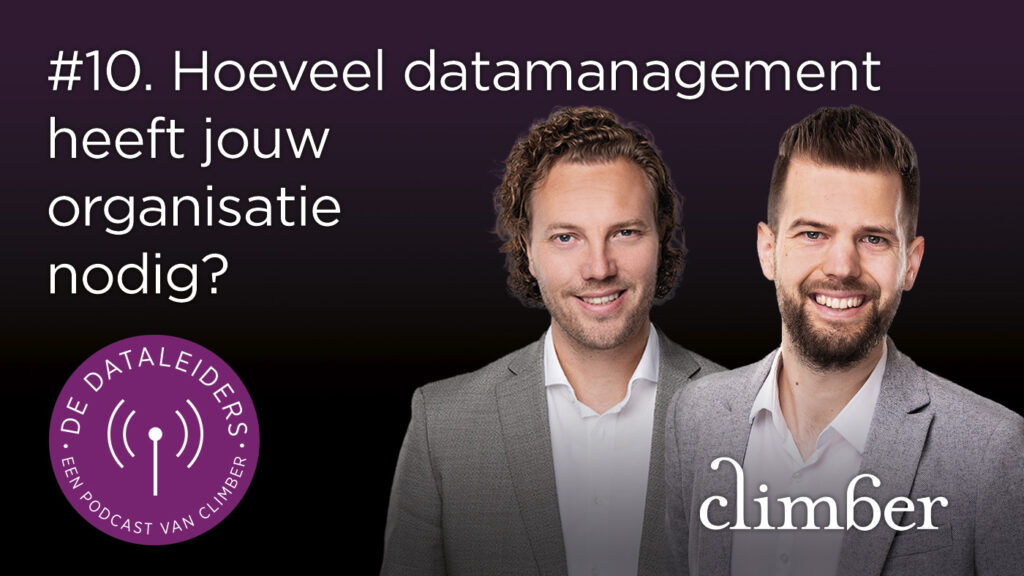
Hoeveel datamanagement heeft jouw organisatie nodig?
Jordy Wegman en Bas Haarhuis bespreken wat datamanagement is, wie verantwoordelijk is en hoe je bepaalt welke afspraken en rollen bij jouw organisatie passen. Aflevering 10 van De Dataleiders & Deel 1 van het tweeluik over datamanagement.
>> Bekijk hier
What’s New in Qlik Cloud – September 2026
This month brings a new input option for Write Table, improved global search function, smarter data stewardship, and a simpler way to move semantic types between environments.
>> Read more
Waarom één dashboard voor iedereen niet werkt
In aflevering 9 van De Dataleiders spreekt Bas Haarhuis met Marnix Kaper, BI Consultant bij Climber, over het beschikbaar maken van data per gebruikersgroep. Je leest wat er misgaat bij één allesomvattend dashboard, hoe je de echte informatiebehoefte achterhaalt en waar je morgen kunt beginnen.
>> Bekijk hier